Simulator mode is specifically designed for topology developers to easily debug or optimize their topologies.
Simulator mode simulates a heron cluster in a single JVM process, which is useful for developing and testing topologies. Running topologies under simulator mode is similar to running topologies on a cluster.
Develop a topology using simulator mode
To run in simulator mode, use the SimulatorMode class, which is
in storm-compatibility-unshaded_deploy.jar (under bazel-bin/heron/storm/src/java).
For example:
import com.twitter.heron.simulator.Simulator;
Simulator simulator = new Simulator();
You can then submit topologies using the submitTopology method on the Simulator object. Just
like the corresponding method on StormSubmitter, submitTopology takes a name, a topology
configuration, and a topology object.
For example:
simulator.submitTopology("test", conf, builder.createTopology());
Other lifecycle methods to use with simulator mode are:
simulator.killTopology("test");
simulator.activate("test");
simulator.deactivate("test");
simulator.shutdown();
To kill a topology, one could also terminate the process.
The simulator mode will run in separate threads other than the main thread. All the above methods are thread-safe. This means that one could invoke these methods in other threads and monitor the corresponding behaviors interactively.
Debug topology using IntelliJ
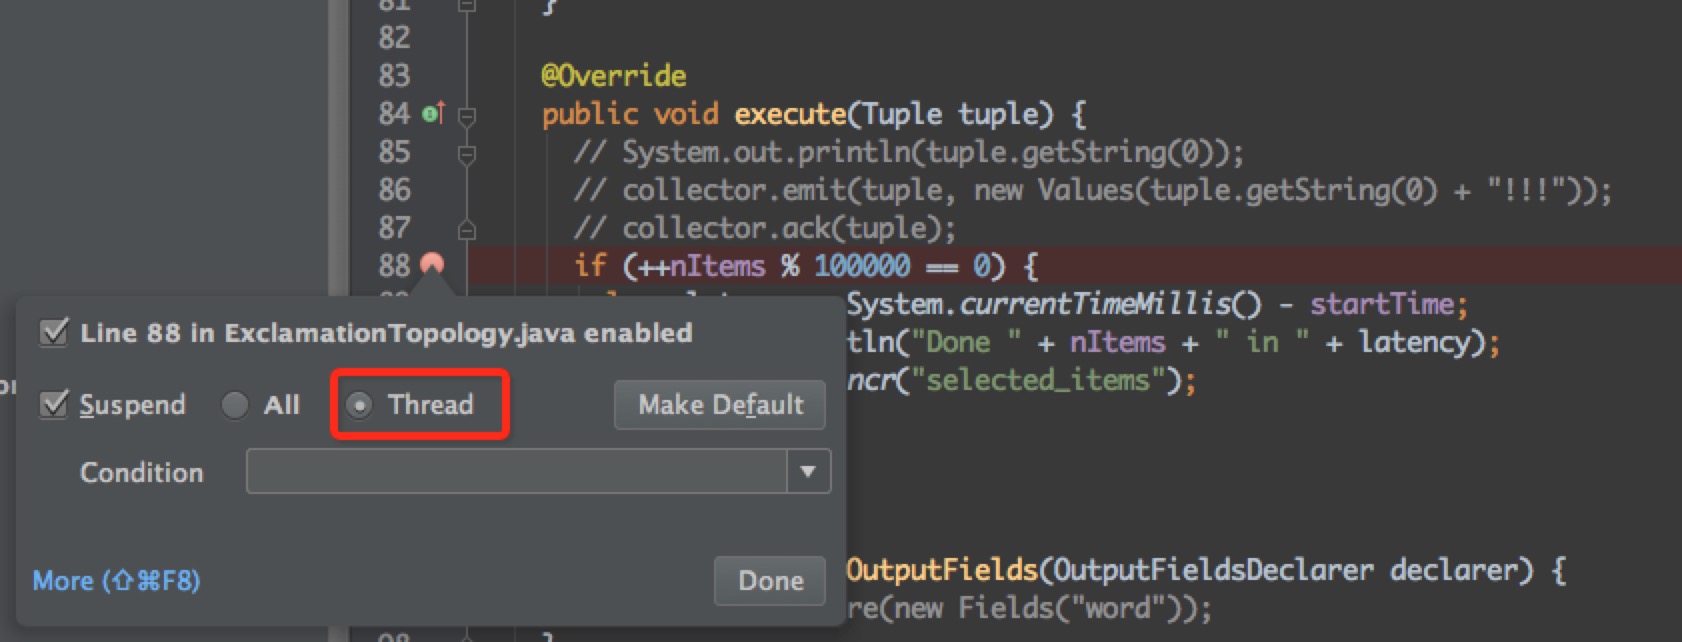
Bolts and Spouts run as separate threads in simulator. To add breakpoints inside a bolt/spout, the Suspend Policy of the breakpoint needs to be set to Thread. To change the Suspend Policy, right click on the breakpoint as shown in the following image:

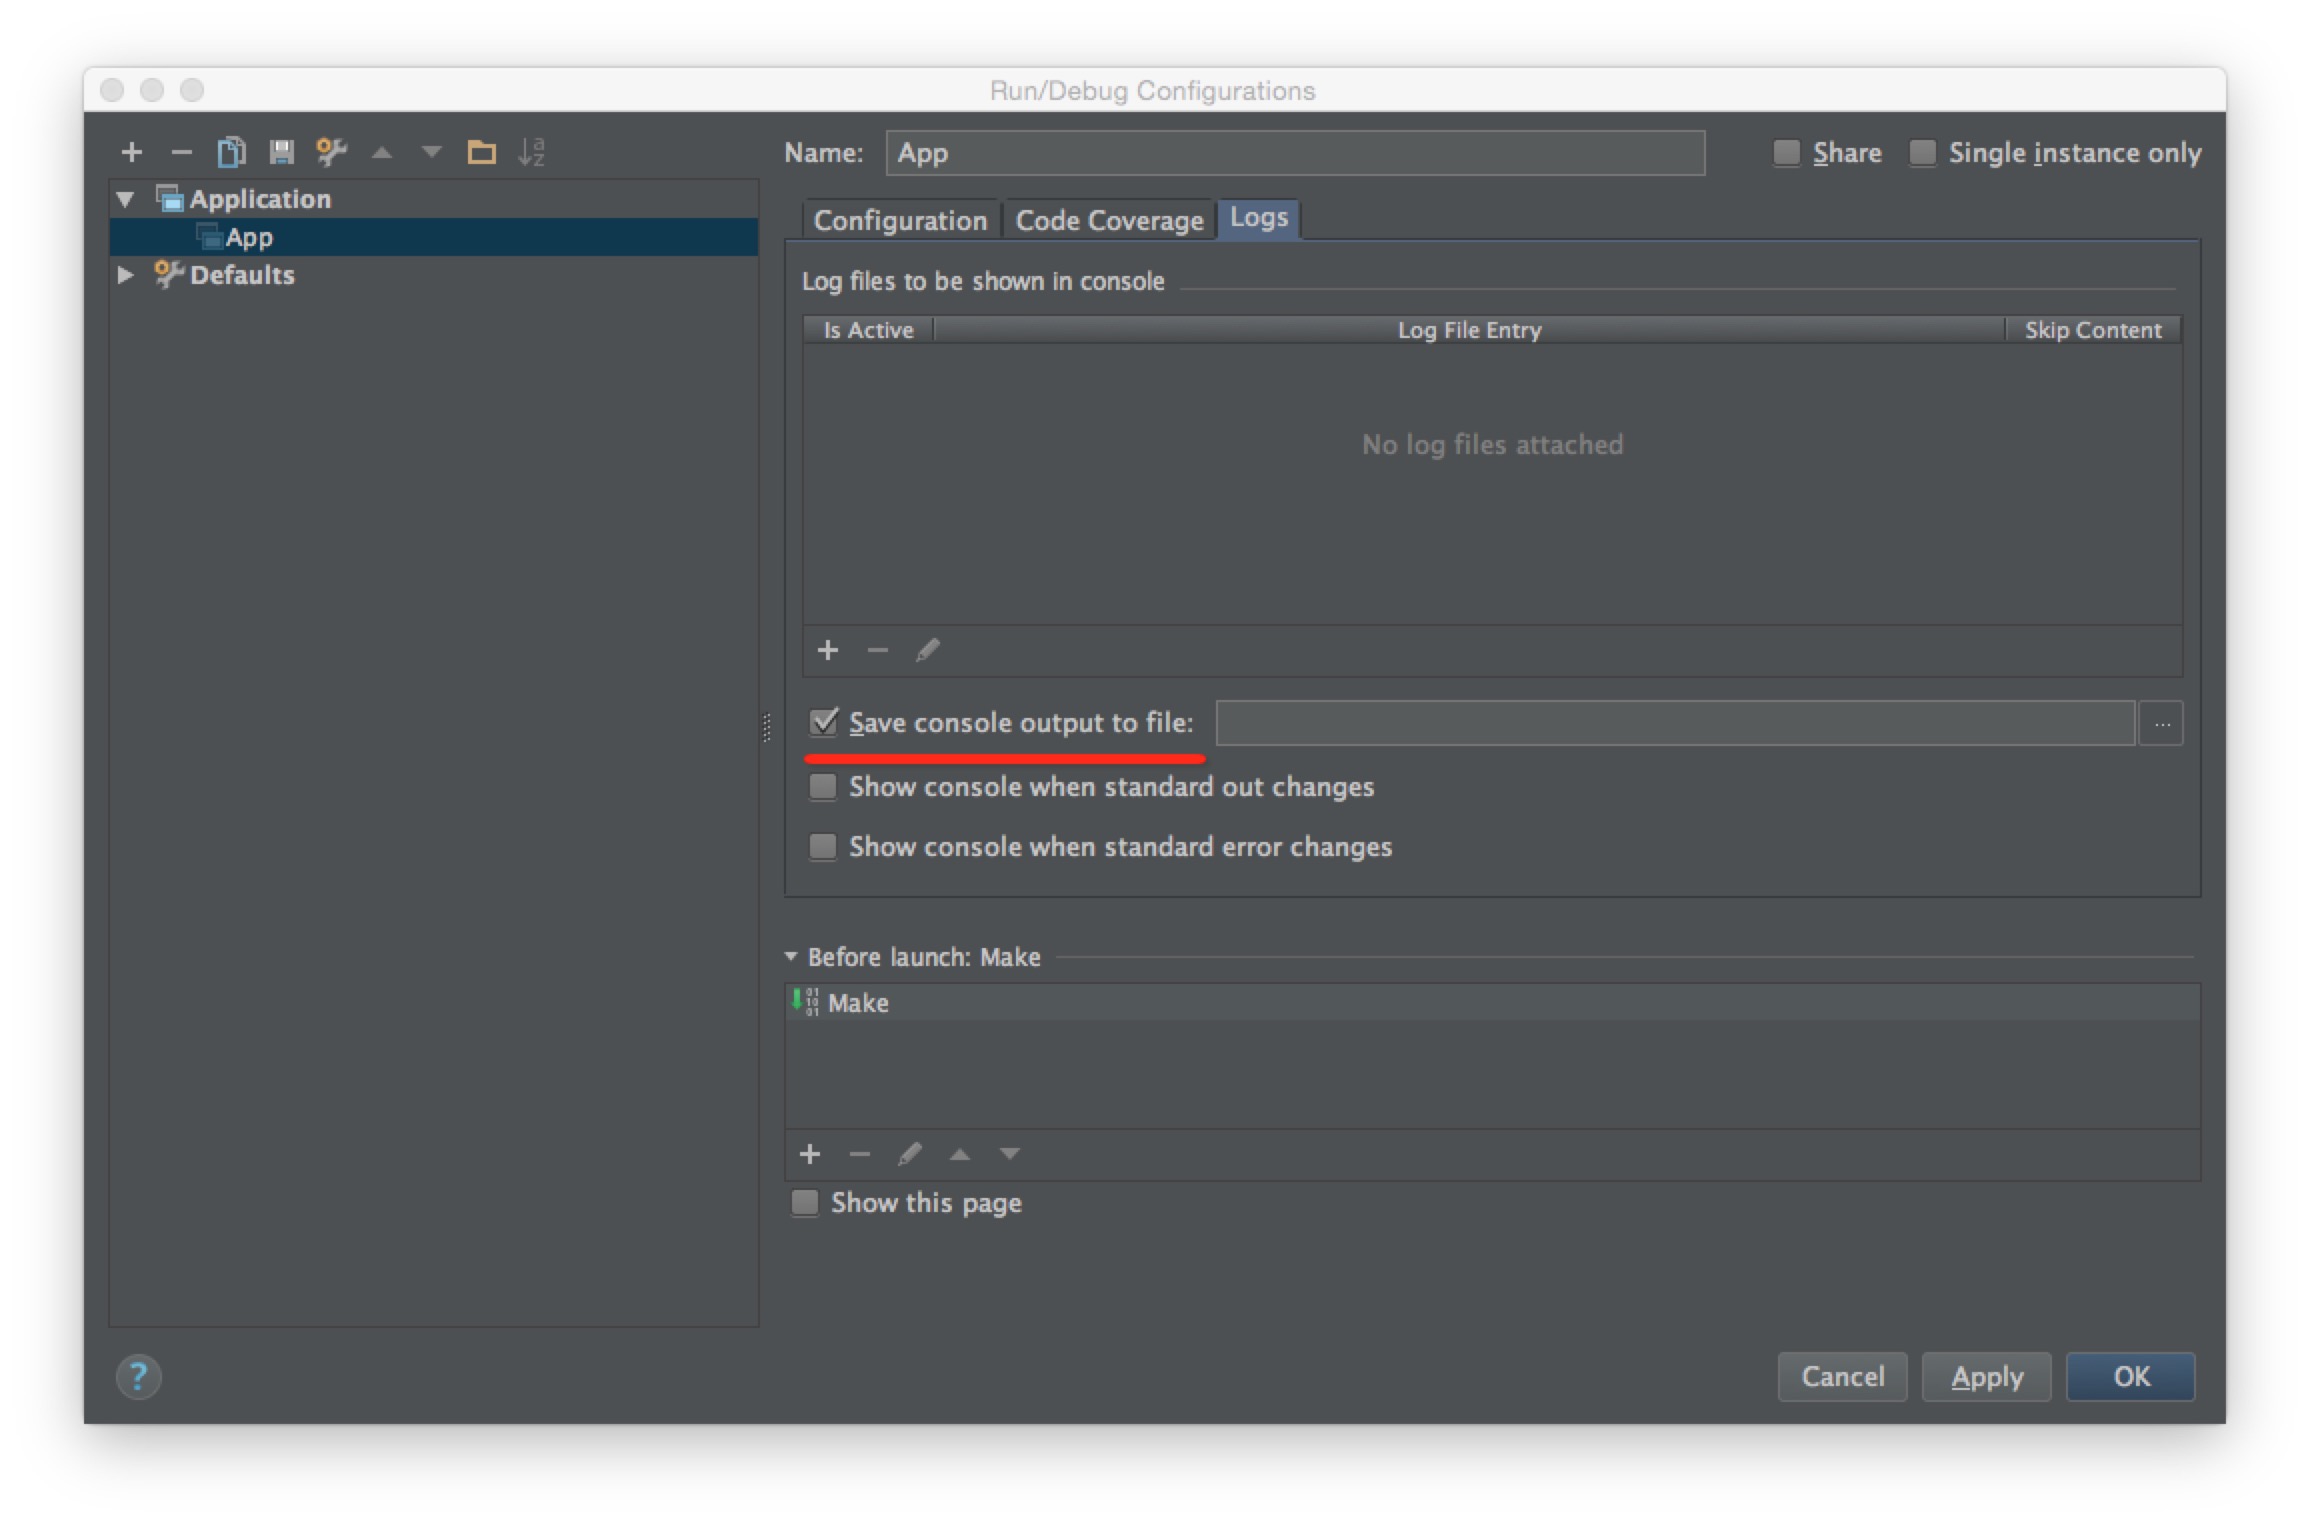
If it’s not convenient to check the output and logs in the IntelliJ console, save them to a local file
by choosing Run -> Edit Configurations.... as shown in the following image:
